5 March 2022
Odyssey logger read out and field deployment
Odyssey light loggers were taken out of the experimental tanks and read out following the instructions in the Odyssey quick start guide.
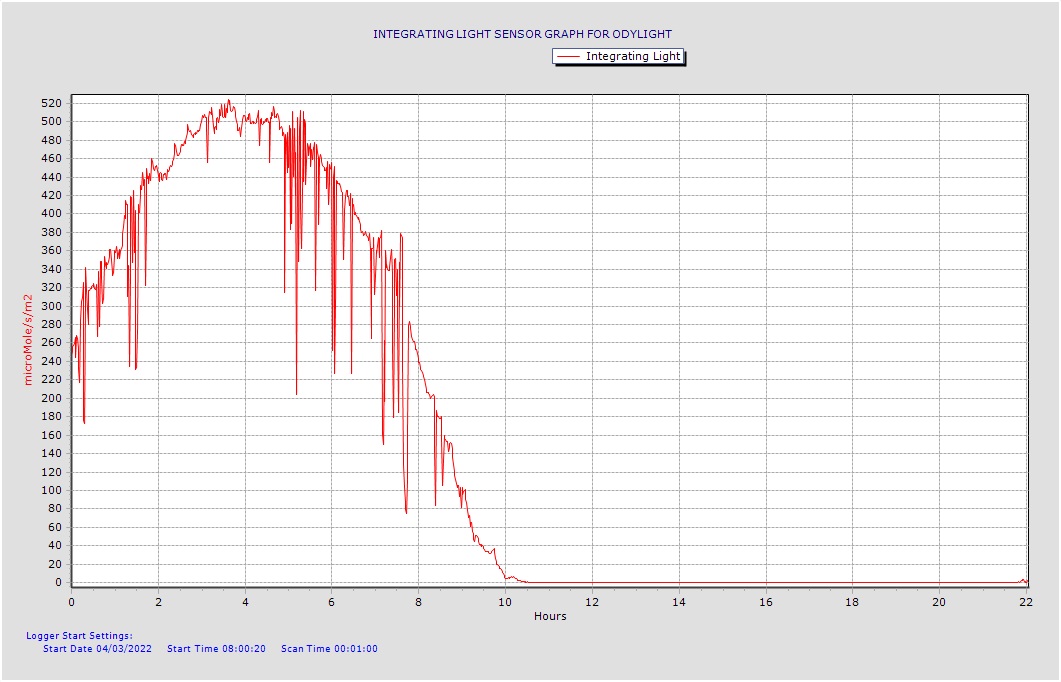
All data were uploaded to the Gametogenesis Project Google Drive folder and the Gametogenesis Timeseries GitHub.
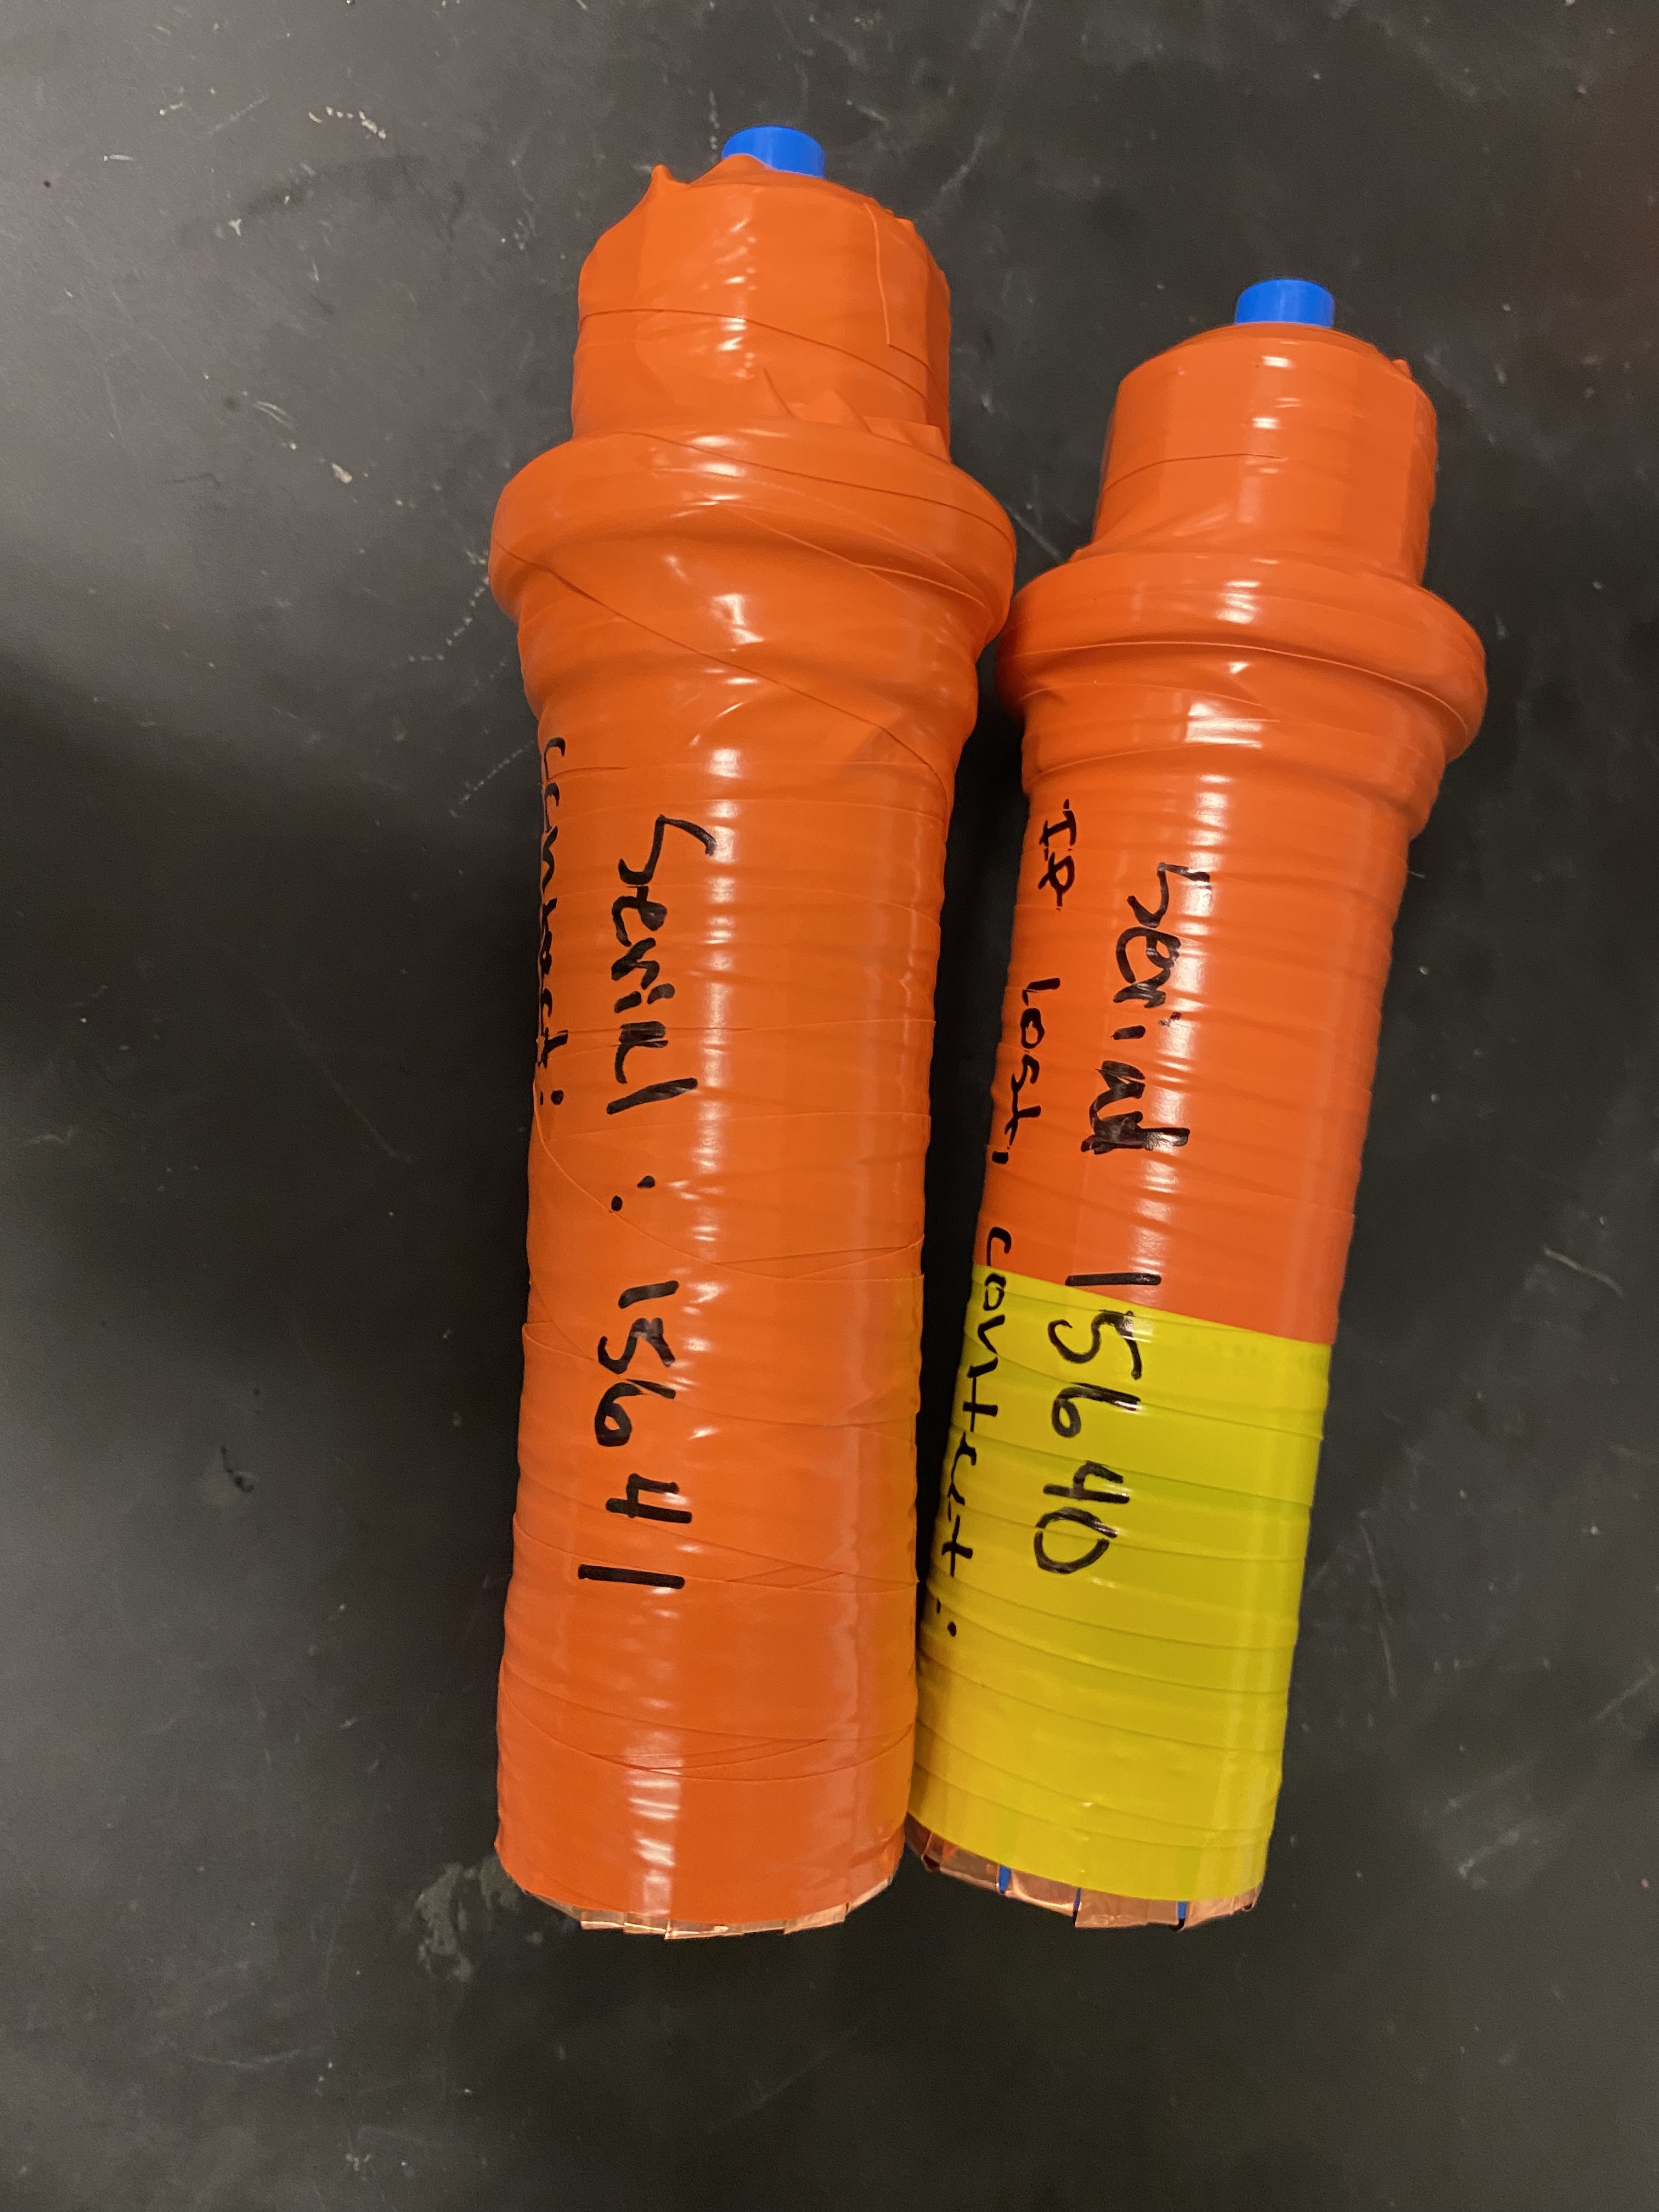
Following the instructions in the Odyssey quick start guide two light loggers were set to:
| Serial Number | Delay Start | Site | End Date | Location |
|---|---|---|---|---|
| 15641 | 20220305 09:00 | Mahana | Last until: October 19th 2022 | Patch 04, next to HOBO 01 and Tag 457 |
| 15640 | 20220305 09:00 | Mahana | Last until: October 19th 2022 | Patch 04, next to HOBO 01 and Tag 457 |
To reduce biofouling, the loggers were wrapped in copper tape at the top and wrapped with electrical tape and labeled.
Field day sampling for PI curves
Lauren and I went to explore our Mahana site (17°29’12.5”S 149°53’16.1”W) to find our patches and tags. After some searching we found them! We put out the light loggers next to patch 04 and collected five ~5 inch Acropora pulchra from the five patches to calculate our photosynthesis to irradiance curves (P-I curve). They are constructed from oxygen-respirometry techniques to assess the irradiance level at which photosynthesis becomes saturated (saturating irradiance, denoted as Ik) for corals at our sites. Irradiance levels that are higher or lower than Ik can reduce the organism’s efficiency to capture and utilize incoming light energy, so being able to identify what level is most conducive for the corals is important for future photosynthetic measurements.
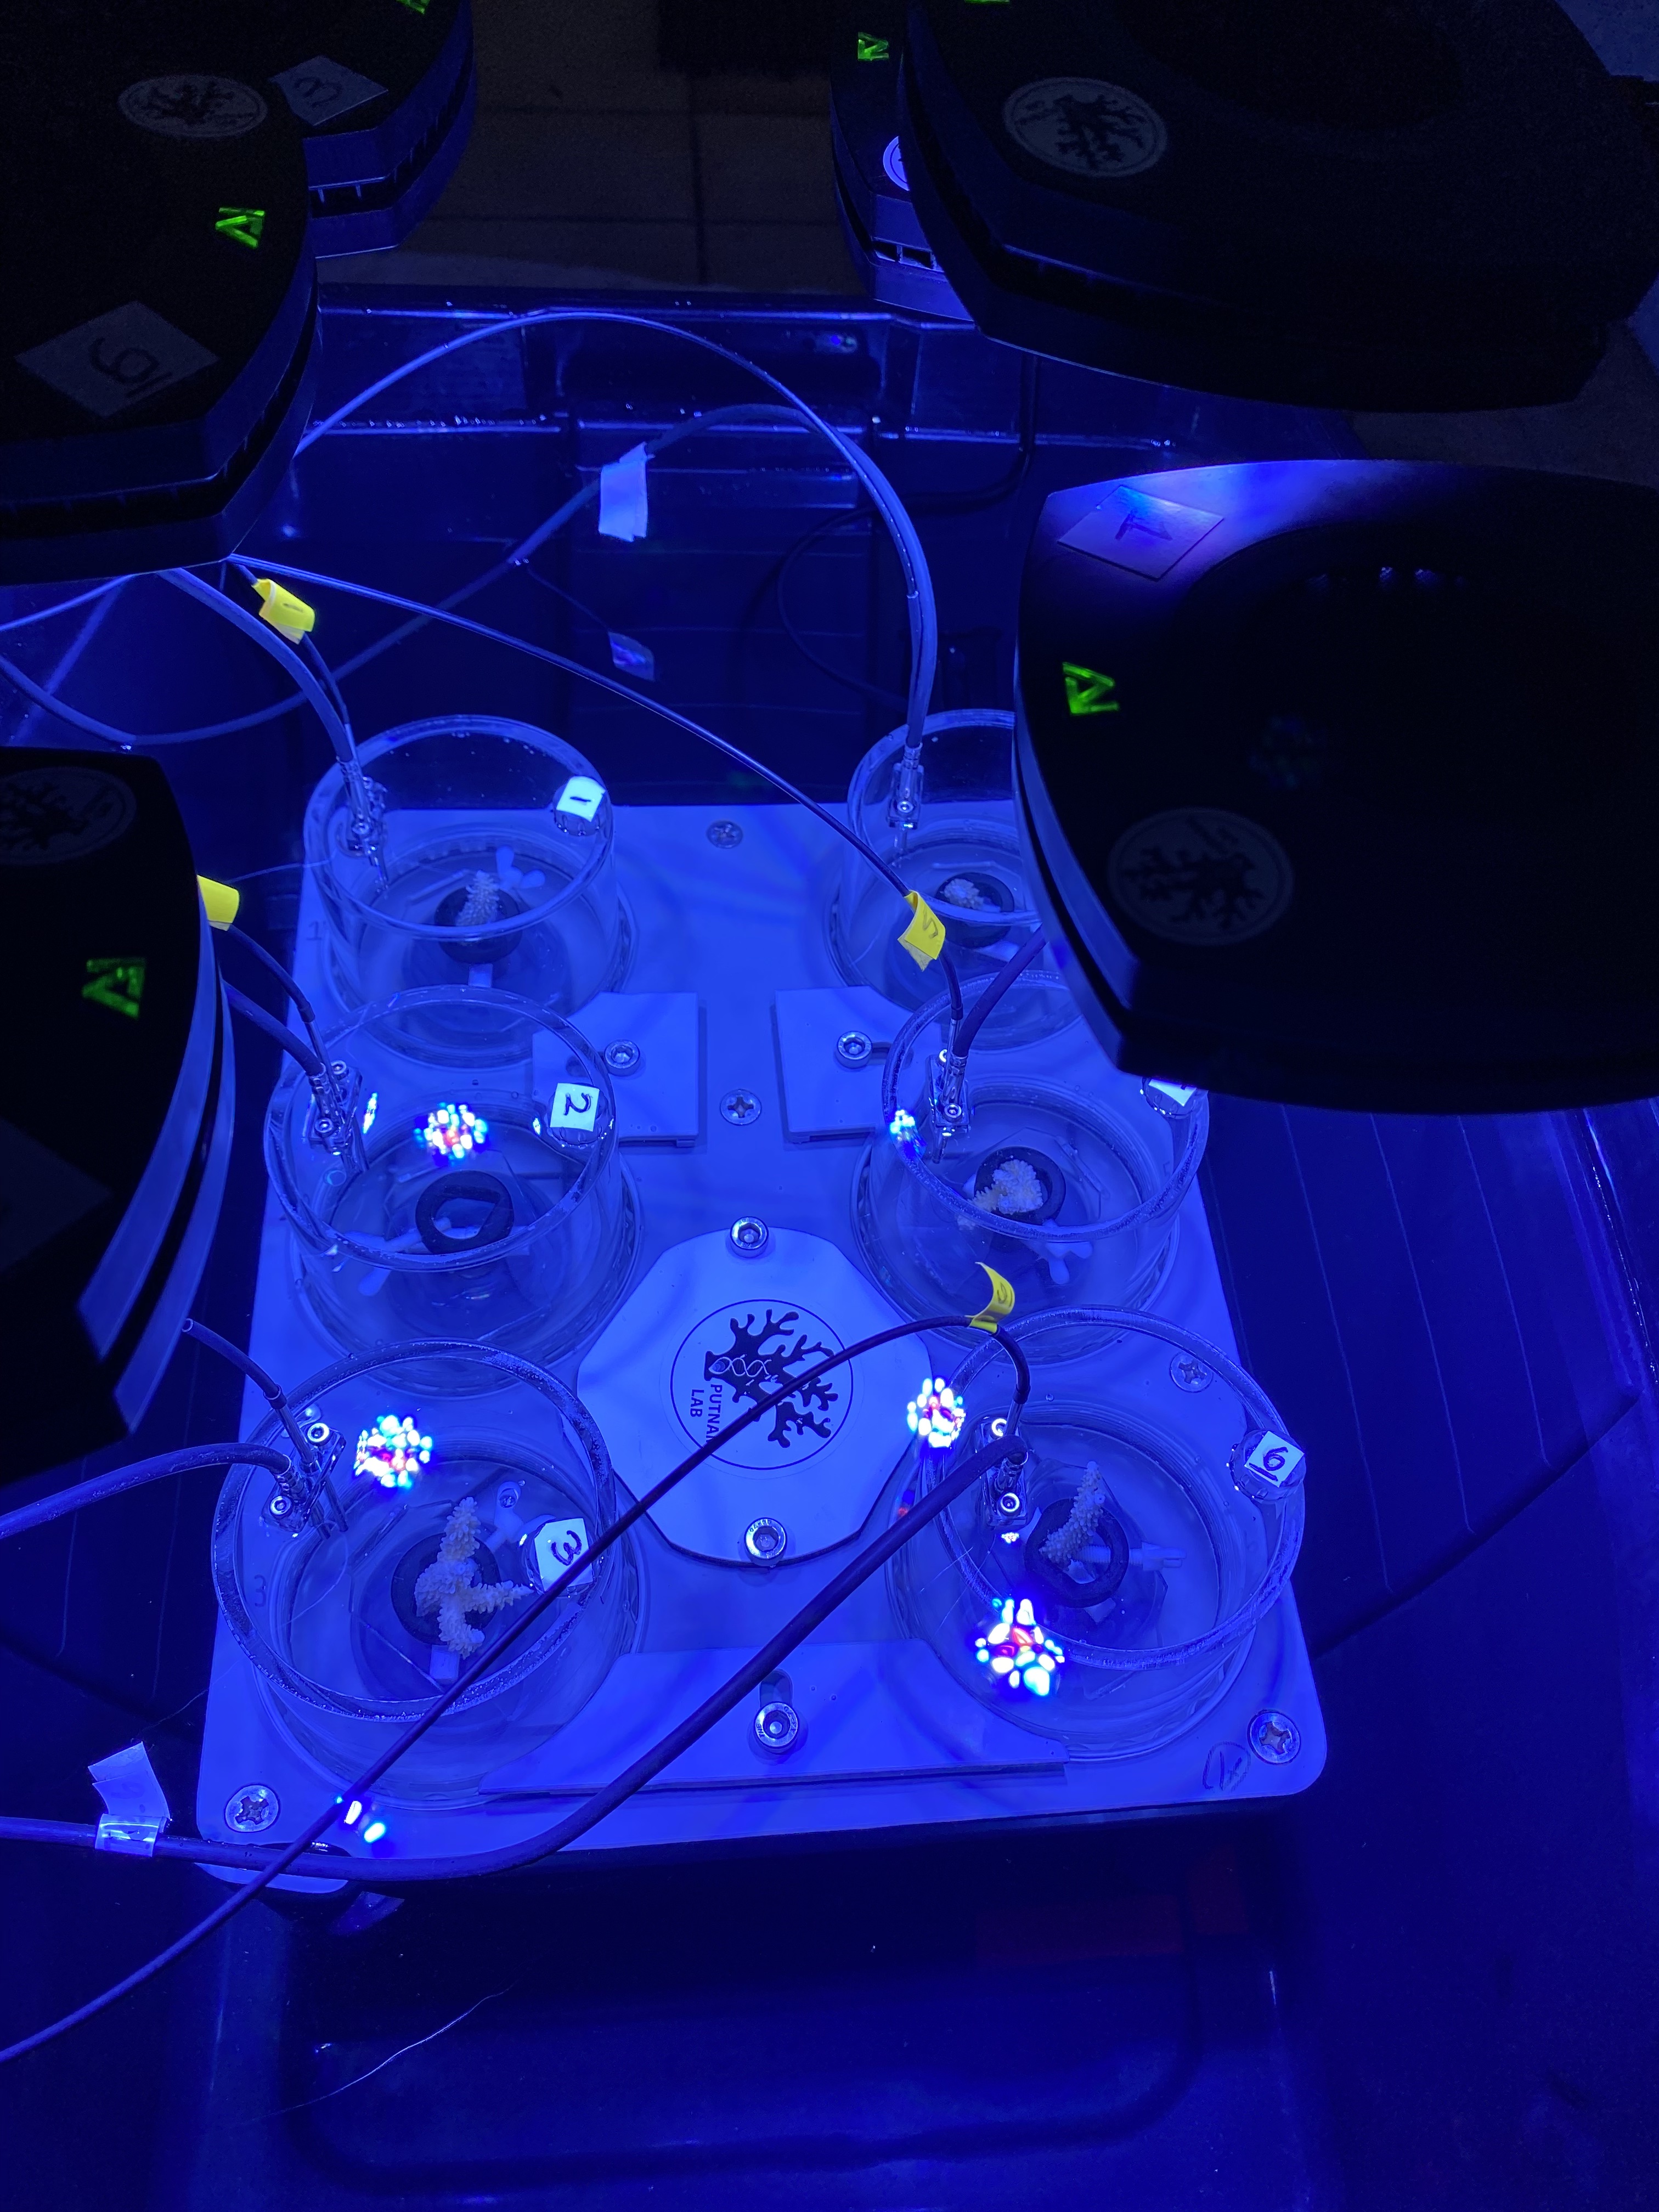
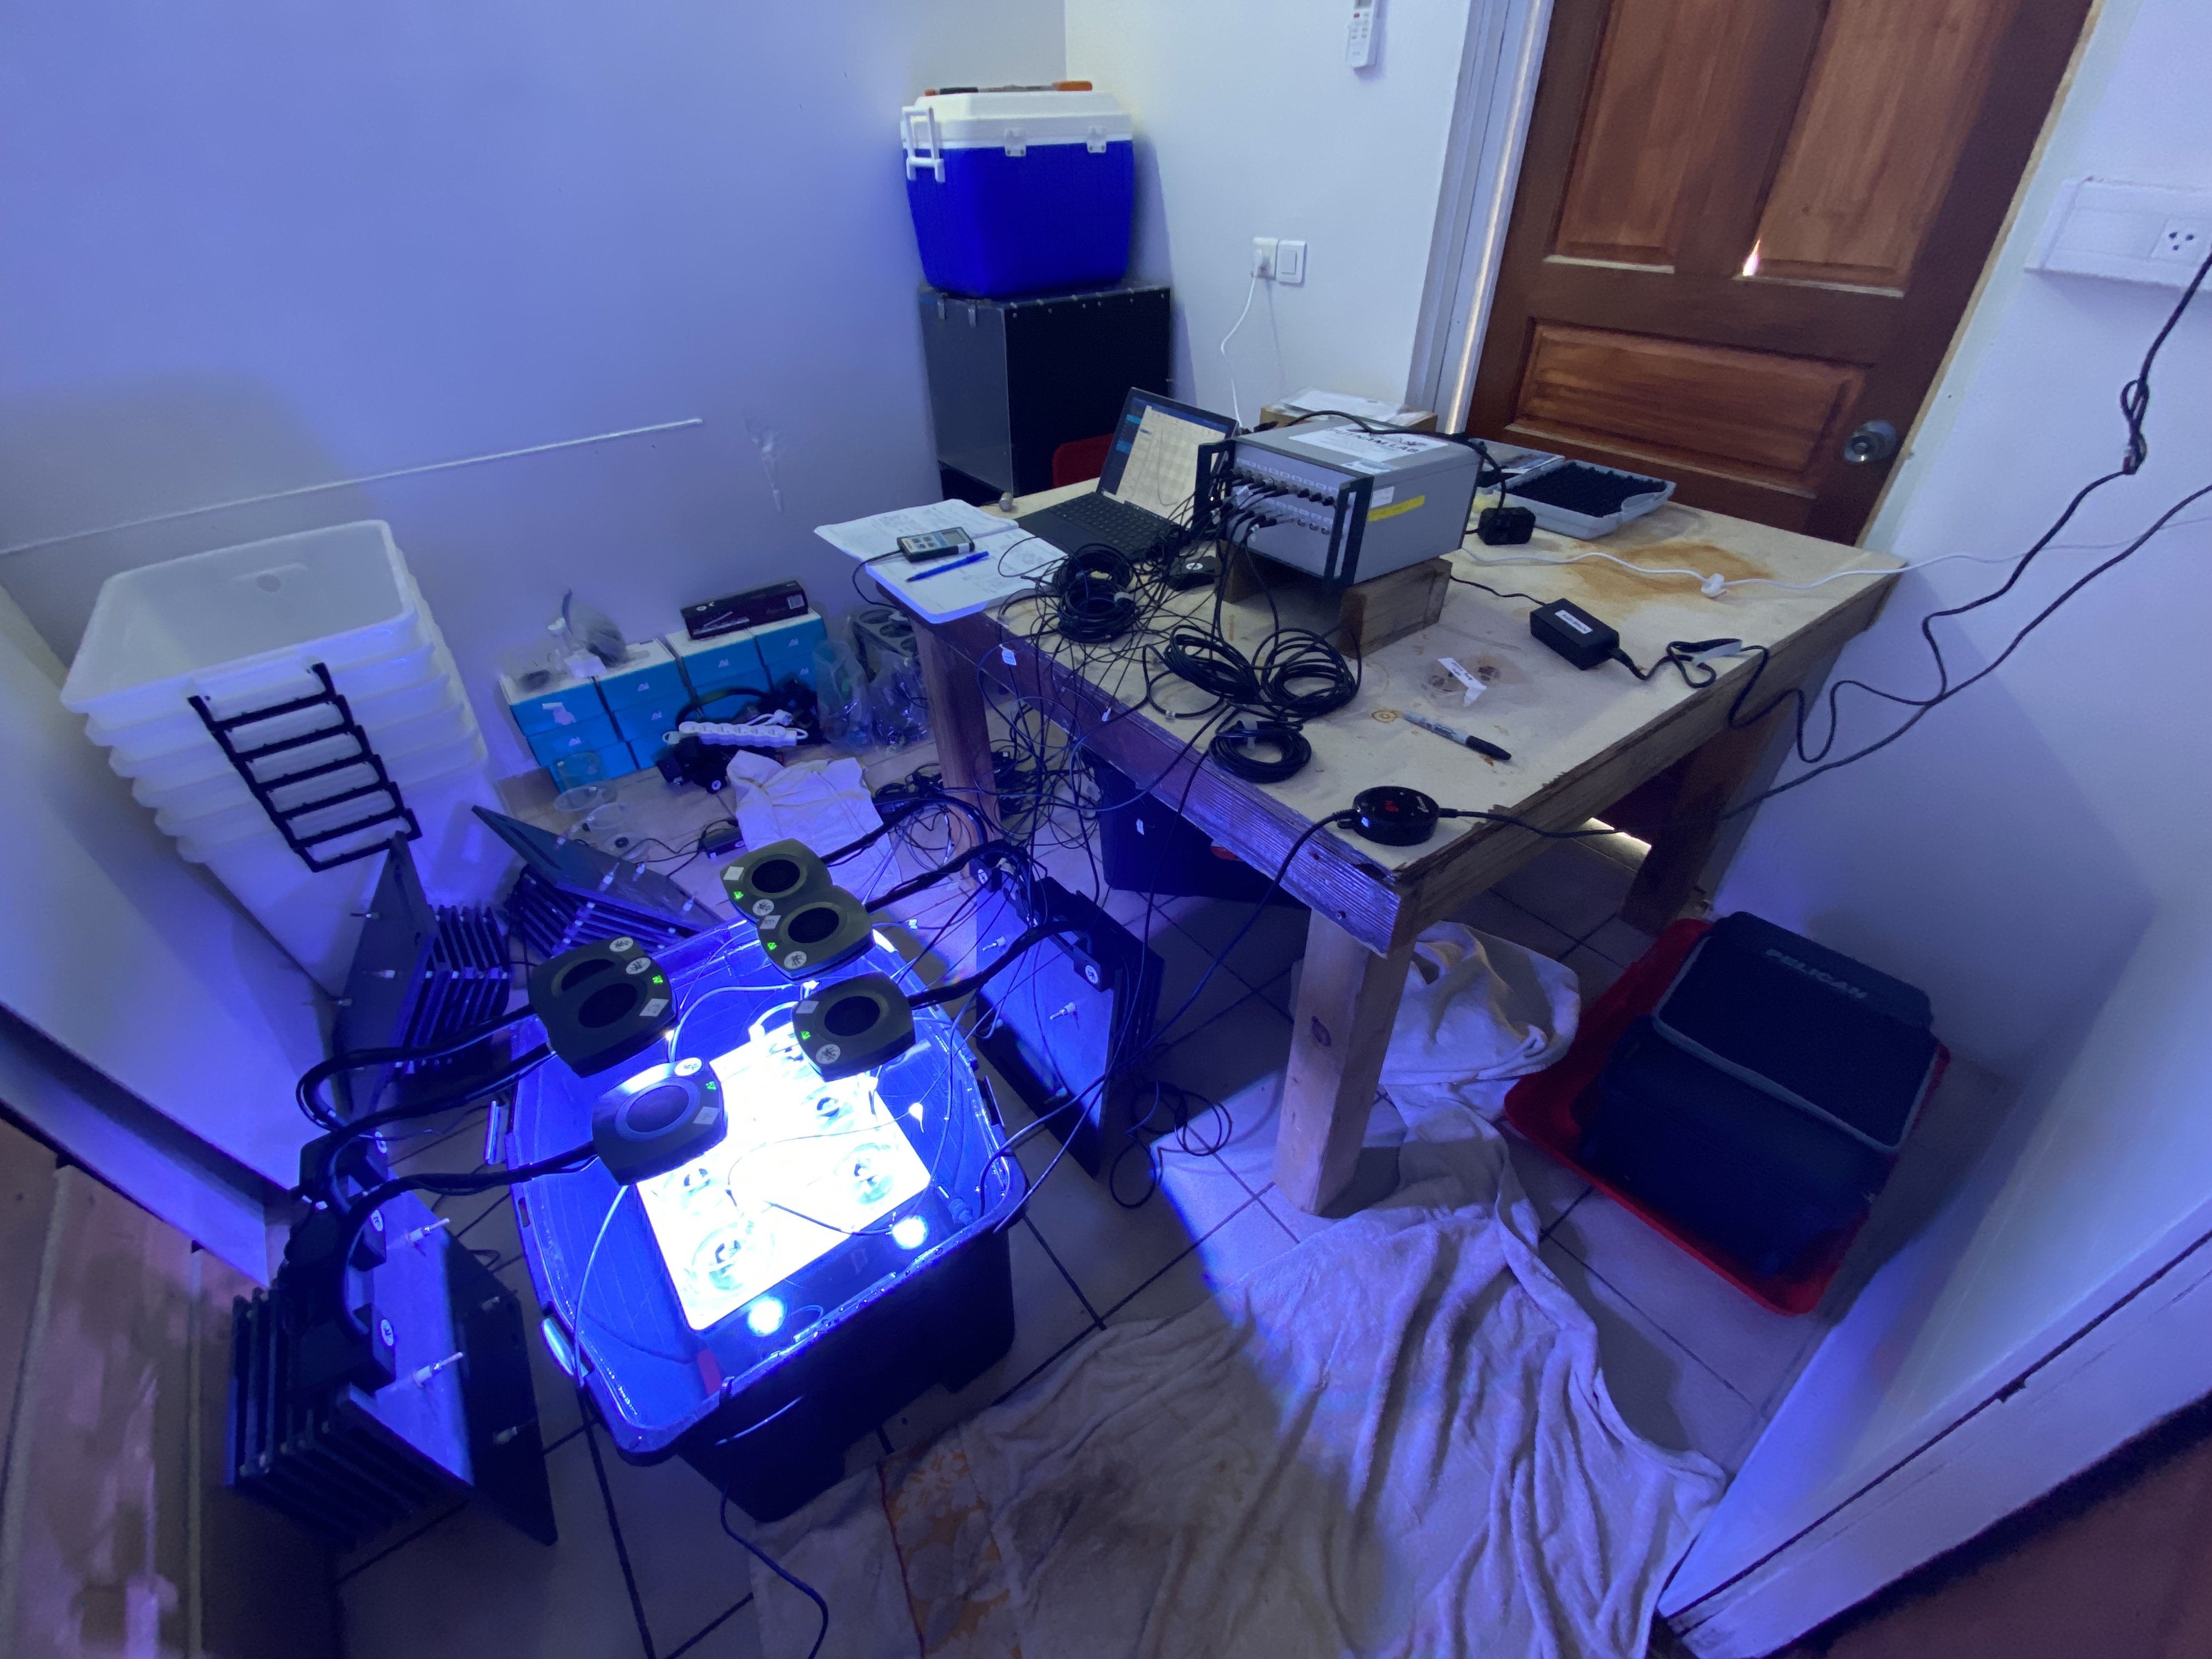
PI curves
Following the PI curve Protocol, PI curves were conducted on five Acropora pulchra coral fragments that had been collected from the Mahana site from various patches used in our monthly sampling. We conduct PI curves to calculate various paramaters like Am (max photosynthetic rate), AQY (alpha), Rd (respiration), and Ik (saturating irradiance). All data and statistics were uploaded to the Gametogenesis Project Google Drive folder and the Gametogenesis Timeseries GitHub.