14 June 2022
Expedition Overview
The purpose of this field expedition is to conduct research during the spawning season for the coral Montipora capitata and the larval brooding season for Pocillopora acuta in Hawaii. Jill Ashey and Ariana Huffmyer (Putnam Lab, URI) and collaborators are conducting research at the Hawaii Institute of Marine Biology in June - July 2022. Projects include characterization of the role of microRNA in coral development see J. Ashey’s notebook here and the timing of symbiotic nutritional exchange see A. Huffmyer’s notebook here.
Tank set up
We were able to finalize the location of outlets and facilitiies helped us to fix outlets that were not working. We also re arranged the location of several tanks to ensure there is enough access to power and outlets as needed.
Larval collection
There was low larval output again today. The CRL lab had the same result. We did have 30 larvae from one colony and the larval release may ramp up over the next week.
Field work preparation
Tomorrow we will go to Reef 13 in Kaneohe Bay to collect live fragments from Montipora capitata bleaching pairs to ship to URI later next week. Today we prepared field supplies.
Respiration equipment set up
Ariana set up larval respiration equipment and did a one point calibration of the PreSens spots in Loligo plates. We have 3 spots that need to be replaced, but unfortunately the replacement spots are too large and could not be changed.
Therefore, these spots should not be used. The wells are marked with a black dot on each plate.
In order to perform a 1-point calibration, Ariana generated a 100% oxygen MilliQ water solution by bubbling air into MilliQ water for ~4 hours prior to calibration. Then fill each well in the plates with this water, allowing at least 10 minutes for the wells to hydrate/soak. After hydration, remove any bubbles with gentle pipetting up and down.
In the SDR PreSens software connect equipment and connect SDR’s. Place the plates on the SDR reader making sure to match the well maps (e.g., A1 on the plate with A1 on the reader). Set the measuring temperature to the current temperature in the incubator (25°C in this case) and select to measure oxygen. Select the PSt5 batch information.
Next, click “Calibration” and click the one-point calibration option. Then, add the known value of 100% Air Saturation. Then click calibration. Repeat for each plate.
This calibration process should be done at the start of each measurement during sampling.
Apex setup for pH experiments
Jill and Federica started and connected an Apex system for Federica’s pH experiments. See our previous posts detailing Apex setup here and here.
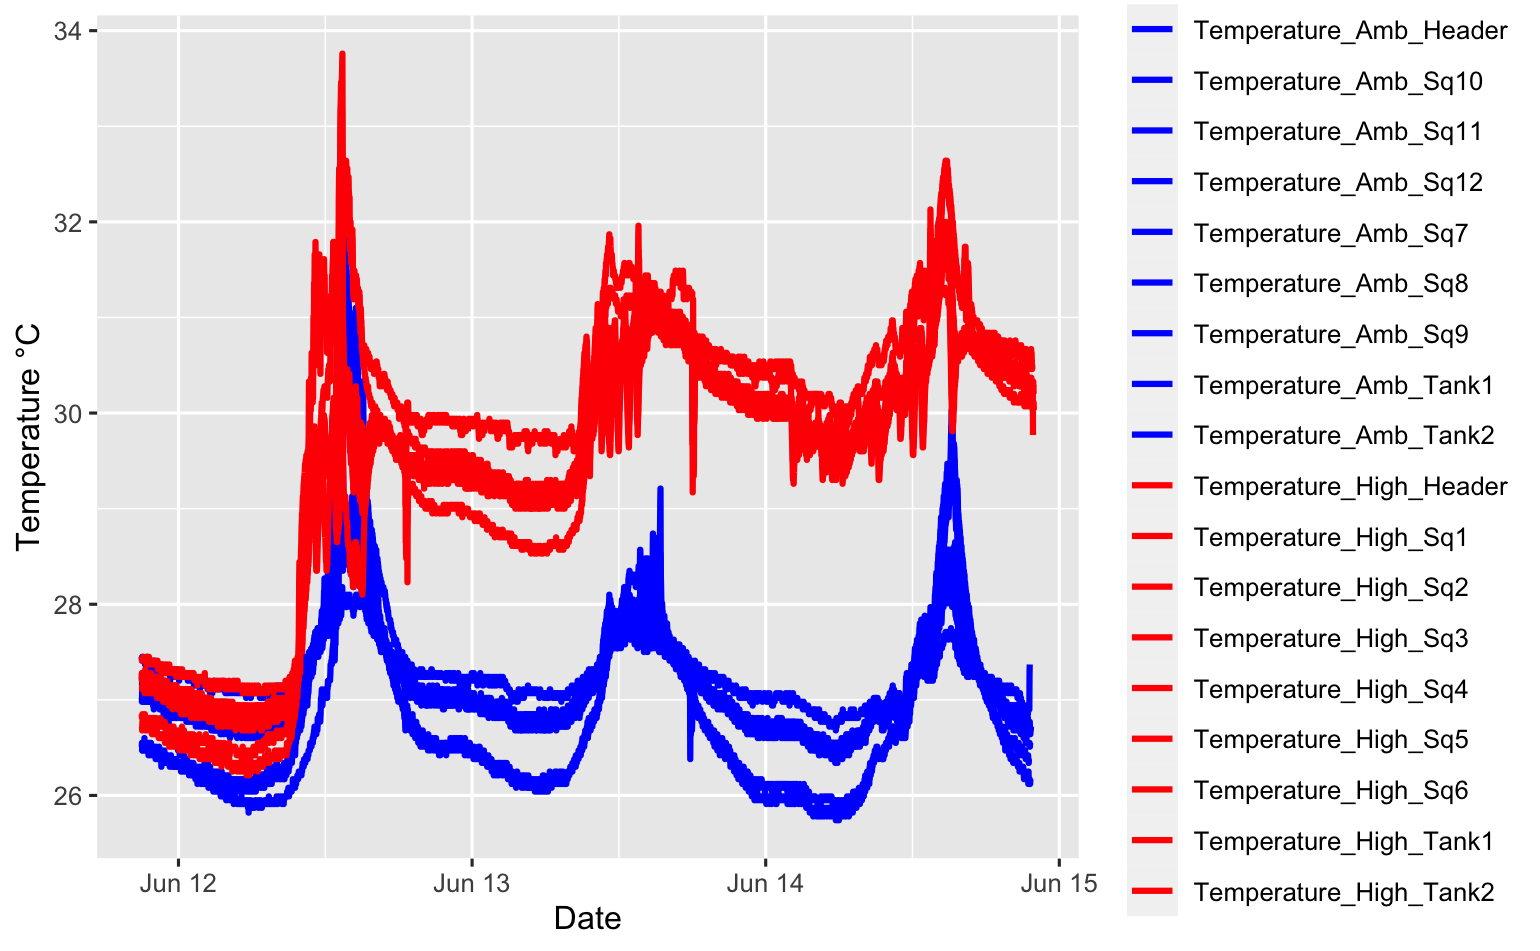
Temperature treatments
Ariana and Jill continued to monitor temperature treatments via the Apex system and loggers. We still are seeing distinct separation between the high and ambient temperature treatments, which is great! We modified our Apex system yesterday so that the high temperature will fluctuate between 29 and 31°C. Below is the updated code for our Apex system.
Real outlets (1-8)
Set OFF
If Output AHStage1 = ON Then ON
If Output AHStage2 = ON Then ON
If Output AHStage3 = ON Then ON
If Output AHStage4 = ON Then ON
If Output AHStage5 = ON Then ON
If Output AHStage6 = ON Then ON
If Output AHStage7 = ON Then ON
If Output AHStage8 = ON Then ON
Virtual outlets
# AHStage1
Set OFF
If H_Sq_1 < 29.7 Then ON
If H_Sq_1 > 29.7 Then OFF
If Time 01:00 to 04:30 Then OFF
If Time 06:45 to 00:59 Then OFF

# AHStage2
Set OFF
If H_Sq_1 < 29.9 Then ON
If H_Sq_1 > 29.9 Then OFF
If Time 01:00 to 03:00 Then OFF
If Time 04:30 to 06:45 Then OFF
If Time 08:15 to 00:59 Then OFF

# AHStage3
Set OFF
If H_Sq_1 < 30.0 Then ON
If H_Sq_1 > 30.0 Then OFF
If Time 01:00 to 02:00 Then OFF
If Time 03:00 to 08:15 Then OFF
If Time 09:45 to 00:59 Then OFF

# AHStage4
Set OFF
If H_Sq_1 < 30.3 Then ON
If H_Sq_1 > 30.3 Then OFF
If Time 02:00 to 09:45 Then OFF
If Time 11:15 to 00:30 Then OFF

# AHStage5
Set OFF
If H_Sq_1 < 30.4 Then ON
If H_Sq_1 > 30.4 Then OFF
If Time 01:00 to 11:15 Then OFF
If Time 12:15 to 23:00 Then OFF
If Time 00:30 to 00:59 Then OFF

# AHStage6
Set OFF
If H_Sq_1 < 30.6 Then ON
If H_Sq_1 > 30.6 Then OFF
If Time 01:00 to 12:15 Then OFF
If Time 13:30 to 19:45 Then OFF
If Time 23:00 to 00:59 Then OFF

# AHStage7
Set OFF
If A_Sq_3 < 30.8 Then ON
If A_Sq_3 > 30.8 Then OFF
If Time 01:00 to 13:30 Then OFF
If Time 15:00 to 17:15 Then OFF
If Time 19:45 to 00:59 Then OFF

# AHStage8
Set OFF
If H_Sq_1 < 31.0 Then ON
If H_Sq_1 > 31.0 Then OFF
If Time 01:00 to 15:00 Then OFF
If Time 17:15 to 00:59 Then OFF
The temperature profiles now look like this. Note that the spike in temperature today was from unpluggin the system while electrical outlets were being fixed. We can see clear separation in our temperature profiles and there is stabilization in the variability between squaricals within temperature treatments.