| Sample counts by layer | |||||||||
| timepoint | colonies | genes | mirna | lncrna | cpg | metabolomics | lipidomics | physiology | its2 |
|---|---|---|---|---|---|---|---|---|---|
| Apul | |||||||||
| TP1 | 43 | 10 | 10 | 10 | 9 | 10 | 10 | 42 | 42 |
| TP2 | 24 | 10 | 10 | 10 | 10 | 0 | 0 | 24 | 23 |
| TP3 | 21 | 10 | 10 | 10 | 10 | 10 | 10 | 21 | 21 |
| TP4 | 34 | 10 | 10 | 10 | 10 | 9 | 9 | 29 | 34 |
| Peve | |||||||||
| TP1 | 45 | 10 | 10 | 10 | 10 | 10 | 10 | 45 | 44 |
| TP2 | 44 | 10 | 10 | 10 | 9 | 10 | 10 | 44 | 42 |
| TP3 | 40 | 9 | 8 | 9 | 9 | 9 | 9 | 40 | 40 |
| TP4 | 38 | 9 | 9 | 9 | 9 | 9 | 9 | 38 | 36 |
| Ptuh | |||||||||
| TP1 | 43 | 10 | 10 | 10 | 9 | 10 | 10 | 43 | 40 |
| TP2 | 45 | 10 | 10 | 10 | 9 | 0 | 0 | 44 | 42 |
| TP3 | 39 | 10 | 10 | 10 | 7 | 10 | 10 | 38 | 39 |
| TP4 | 40 | 9 | 9 | 9 | 7 | 9 | 9 | 40 | 38 |
Data QC and design overview
Harmonized from MOSAiC commit 86432e3; lock updated 2026-10-07. Every table here is derived from config/design.csv and data/derived/, which are what every hypothesis reads.
Samples per species, timepoint, and layer
Colony coverage
Which colonies have which timepoints in the gene-expression layer. Gaps matter for every repeated-measures model.
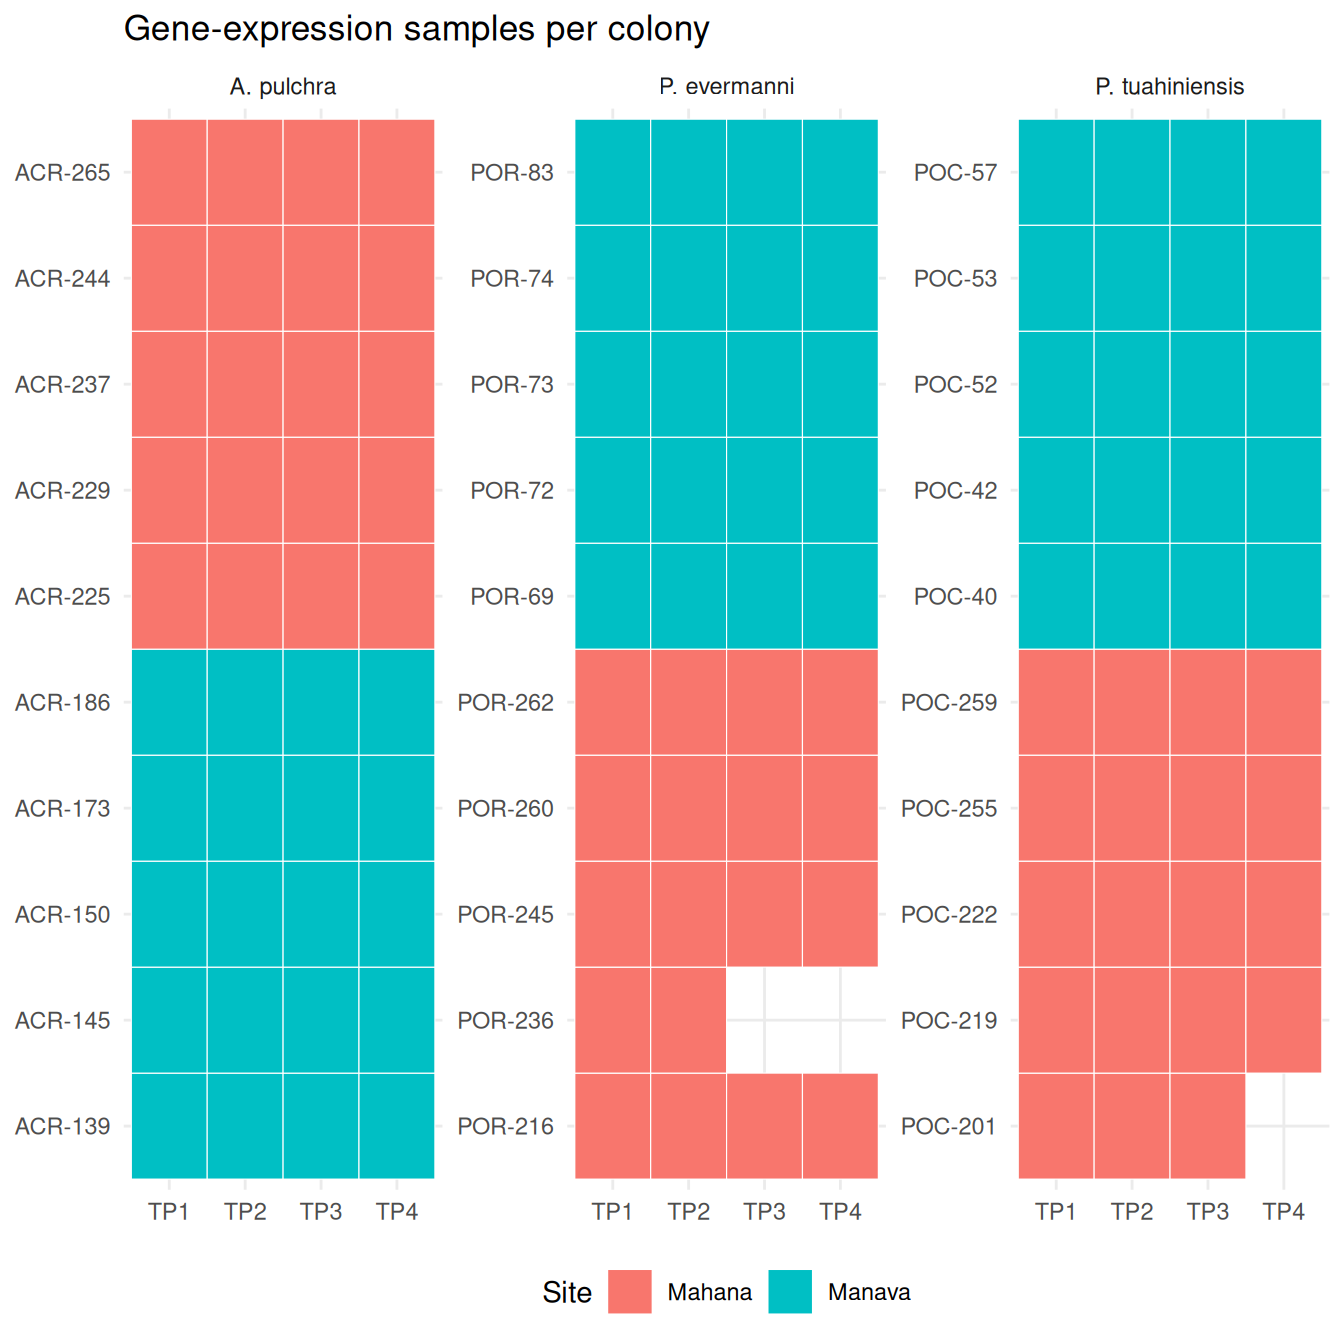
Layer overlap
Number of samples shared between each pair of layers (all species pooled). The diagonal is the layer’s own n.
| Pairwise sample overlap | ||||||||
| layer | genes | mirna | lncrna | cpg | metabolomics | lipidomics | physiology | its2 |
|---|---|---|---|---|---|---|---|---|
| genes | 117 | 116 | 117 | 108 | 96 | 96 | 116 | 113 |
| mirna | 116 | 116 | 116 | 107 | 95 | 95 | 115 | 112 |
| lncrna | 117 | 116 | 117 | 108 | 96 | 96 | 116 | 113 |
| cpg | 108 | 107 | 108 | 108 | 88 | 88 | 107 | 104 |
| metabolomics | 96 | 95 | 96 | 88 | 96 | 96 | 96 | 92 |
| lipidomics | 96 | 95 | 96 | 88 | 96 | 96 | 96 | 92 |
| physiology | 116 | 115 | 116 | 107 | 96 | 96 | 448 | 433 |
| its2 | 113 | 112 | 113 | 104 | 92 | 92 | 433 | 441 |
Samples present in every molecular layer (genes, mirna, lncrna, cpg, metabolomics, lipidomics), per species:
| species | TP1 | TP3 | TP4 | TP2 |
|---|---|---|---|---|
| Apul | 9 | 10 | 9 | 0 |
| Peve | 10 | 8 | 9 | 9 |
| Ptuh | 9 | 7 | 7 | 0 |
Site and nutrient balance
| Colonies per site x nutrient | ||||
| site | nutrient | Apul | Peve | Ptuh |
|---|---|---|---|---|
| Hilton | Medium | 15 | 15 | 15 |
| Mahana | Low | 19 | 16 | 15 |
| Manava | High | 16 | 15 | 15 |
Gene-expression library sizes and PCA
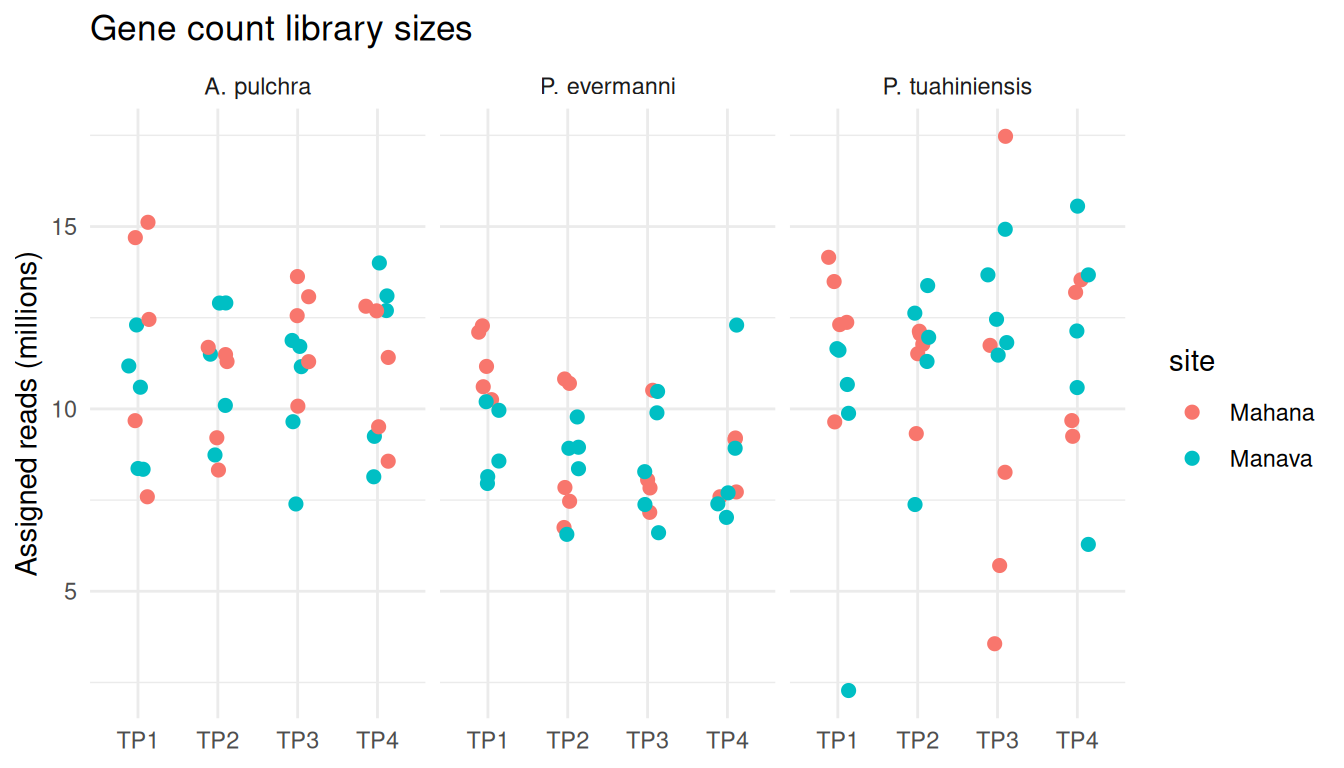
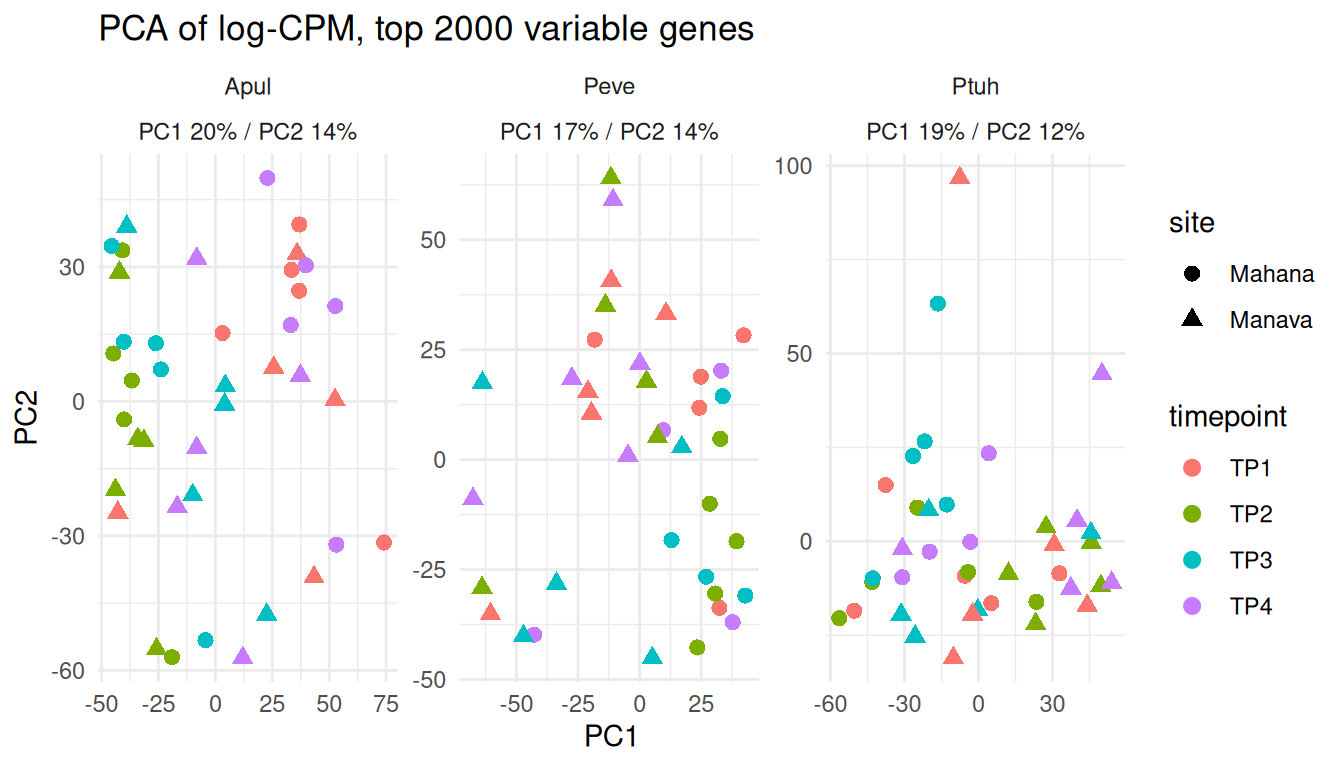
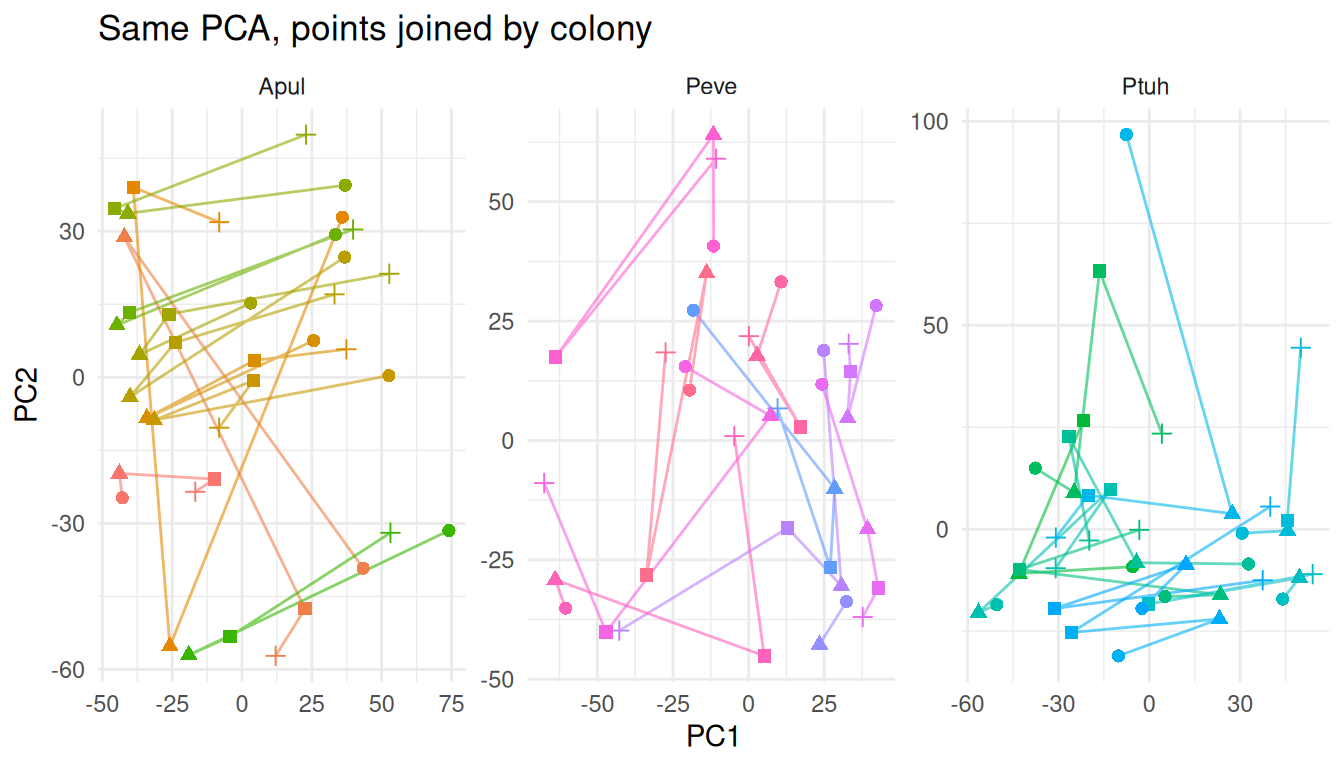
Colonies are connected across timepoints below; tight clusters per colony indicate colony-dominated variance (the H01 question).
Ortholog coverage
| Three-way ortholog groups resolvable in each count matrix | |||
| species | orthologs_in_counts | total | with_protein_name |
|---|---|---|---|
| Apul | 10258 | 10381 | 4054 |
| Peve | 10381 | 10381 | 4054 |
| Ptuh | 10381 | 10381 | 4054 |
Temperature history before each timepoint
Daily mean per site with the nominal timepoint dates (mid-month; decision D-006).
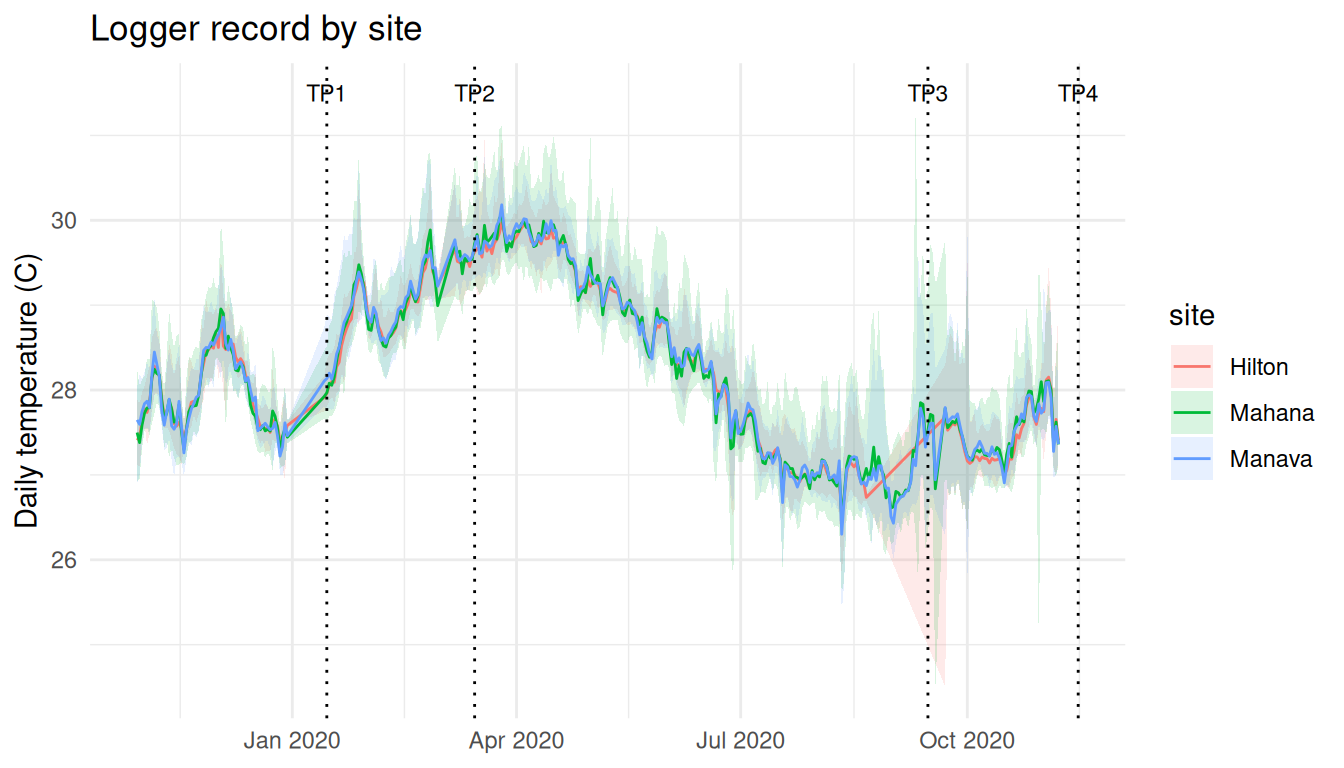
| 30-day window before each nominal timepoint date | ||||||||||||
| site | mean_30d_TP1 | mean_30d_TP2 | mean_30d_TP3 | mean_30d_TP4 | max_30d_TP1 | max_30d_TP2 | max_30d_TP3 | max_30d_TP4 | days_TP1 | days_TP2 | days_TP3 | days_TP4 |
|---|---|---|---|---|---|---|---|---|---|---|---|---|
| Hilton | 27.61 | 29.35 | 26.93 | 27.62 | 28.37 | 30.57 | 27.92 | 29.46 | 16 | 24 | 5 | 22 |
| Mahana | 27.60 | 29.39 | 27.06 | 27.71 | 28.52 | 30.80 | 31.33 | 29.49 | 16 | 24 | 30 | 22 |
| Manava | 27.61 | 29.42 | 27.00 | 27.66 | 28.89 | 30.72 | 29.61 | 29.29 | 16 | 24 | 30 | 22 |
Upstream files
| id | MB | md5 | fetched_on |
|---|---|---|---|
| genes_Apul | 5.32 | 6d9c7c720951658ab7c4a552c9bfc926 | 2026-10-06 |
| genes_Peve | 4.83 | 2bf812e537f6c901d3b1d6f659c31398 | 2026-10-06 |
| genes_Ptuh | 5.30 | 4ab30984dc7d58f7d67081d09278bacc | 2026-10-06 |
| mirna_Apul | 0.01 | 5f63500760989ea2effa22ea4bbf961c | 2026-10-06 |
| mirna_Peve | 0.01 | 48f31811f25d04767adb0ec0fe62443a | 2026-10-06 |
| mirna_Ptuh | 0.01 | 10209712f953cba5ac2674ae63ace7e2 | 2026-10-06 |
| mirna_results_Apul | 2.81 | 026c1850ecc92c67829ae2adbb4f4f31 | 2026-10-07 |
| mirna_results_Peve | 2.81 | 90ebaf1ffc4587515277914f6339256c | 2026-10-07 |
| mirna_results_Ptuh | 1.47 | a1e257d21015e41a091f2cddc2aeebc8 | 2026-10-07 |
| lncrna_Apul | 3.75 | 5aeb38c643298bbc3f0d8520964d157e | 2026-10-06 |
| lncrna_Peve | 1.90 | ec6e720bcde1cf6c606a29e0e652f749 | 2026-10-06 |
| lncrna_Ptuh | 3.00 | fbeaf0fda52378f611f779efb3eb004f | 2026-10-06 |
| cpg_Apul | 25.28 | 47135a4e5302b908a39bdd50c14dd7cf | 2026-10-06 |
| cpg_Peve | 63.83 | 0840708bad79d61e5e55405d6c9a5a75 | 2026-10-06 |
| cpg_Ptuh | 396.64 | 6d200bd90e427869b78c8e643c1e156b | 2026-10-06 |
| metabolomics | 0.23 | 210731535861bd44f626267ed158f605 | 2026-10-06 |
| lipidomics | 0.63 | 6da212cbf7816f1f426d5c1bb33caaaa | 2026-10-06 |
| physiology | 0.36 | a88028dd07a17945fc1e61d2e6cbefe3 | 2026-10-06 |
| its2 | 0.09 | f82988f58109f845113b901dc0ec7d3a | 2026-10-06 |
| orthologs_three_way | 7.63 | c97f836634ffe3c954da66f057f9537d | 2026-10-06 |
| orthologs_annotated | 10.14 | 68077915d6031cfae8587ceca06ba048 | 2026-10-06 |
| temperature | 10.93 | 53b034248359ba4a40f73f22ed2dd336 | 2026-10-06 |
| gff_Apul | 46.55 | a7ffef0ed79ec223aa0ffca90a2720ce | 2026-10-06 |
| gff_Peve | 55.14 | aa9fbc27f31a1e4c643a67bb004a50c2 | 2026-10-06 |
| gff_Ptuh | 87.25 | bca9c5a378c3b20592fee38d4dd4f722 | 2026-10-06 |